Demand Forecasting and Inventory Planning
A demand planner's job done on real data: two years of sales from a UK online retailer, 1.07 million sales lines. Weekly demand for the top 25 products is forecast three ways, scored on an 8 week holdout, and turned into safety stock, reorder points and a live reorder list in Power BI.
The problem
Weekly wholesale demand is lumpy, so the planner needs to know which forecasting method to trust for each product and when to reorder.
What I built
Three forecasting methods
seasonal naive, an 8 week moving average and Holt Winters (statsmodels).
Holdout scoring
each method scored on the last 8 weeks with MAPE, weighted MAPE and bias.
Best method per product
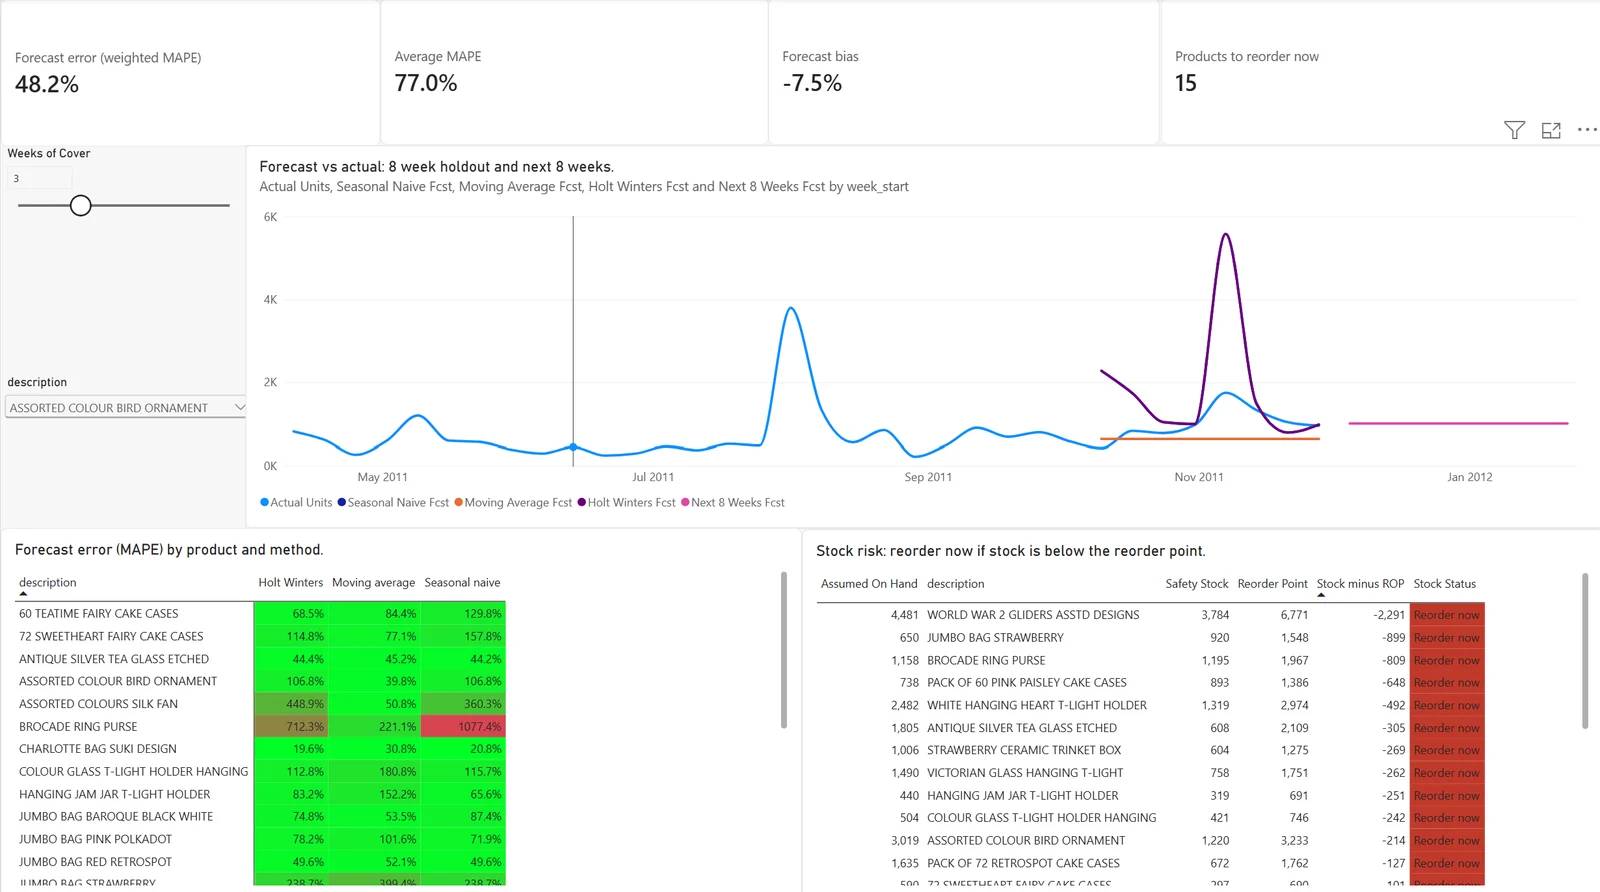
the moving average won on 14 of 25 products, and best method selection gave a weighted MAPE of 48.2% with minus 7.5% bias.
Inventory plan
safety stock and reorder points at a 95% service level and 2 week lead time.
Planning page
a weeks of cover slider showing 15 of 25 products needing an order at 3 weeks of cover, falling to 6 at 4 weeks.
How it works
Cleaning the sales lines
The two yearly sheets overlapped, so 22,000 duplicate rows were removed. Cancellations were kept as negative quantities, so an order cancelled the same day does not look like demand.
Weekly demand in SQL
Built weekly demand for the top 25 products in SQL (SQLite), using a recursive CTE and window functions.
Forecasting and scoring
The last 8 weeks were held out and forecast three ways: same week last year, an 8 week moving average and Holt Winters. The simple moving average won on 14 of 25 products, because weekly wholesale demand is lumpy. Picking the best method per product gave a weighted MAPE of 48.2% and a slight under forecast of 7.5%.
From forecast to reorder list
Safety stock comes from the forecast error at a 95% service level and a 2 week lead time, then a reorder point per product. In Power BI a DAX what if parameter drives a weeks of cover slider: at 3 weeks of cover 15 products need ordering, and at 4 weeks only 6.
Result
Best method weighted MAPE 48.2%, bias minus 7.5%, 15 of 25 products to reorder at 3 weeks of cover
"Forecast weekly demand for 25 products from 1.07 million sales lines, compared 3 methods on an 8 week holdout (weighted MAPE 48.2%, bias minus 7.5%), and turned the result into safety stock, reorder points and a reorder list."